
In a modern banking environment, software platforms are built on complex IT infrastructures, support multiple operating systems, and rely on diverse technologies. For the Information Technology Department, a rising challenge emerged: system users and customers expected rapid feature deployment without compromising software quality or security.
Compounding this pressure, the QA team faced a common industry bottleneck—the testing window was frequently squeezed due to development builds arriving later than scheduled. Testers simply lacked the time and resources to manually execute every designed scenario before delivery deadlines. Traditional “Plan B” options (pulling QA resources from other teams) or “Plan C” approaches (diverting development and DevOps efforts entirely to testing) proved highly disruptive and ineffective.
To overcome these timeline constraints without sacrificing quality, the financial institution needed an intelligent, structured methodology to prioritize test cases from a business risk and customer experience perspective.
Implementing the Automation Test Strategy (ATS)
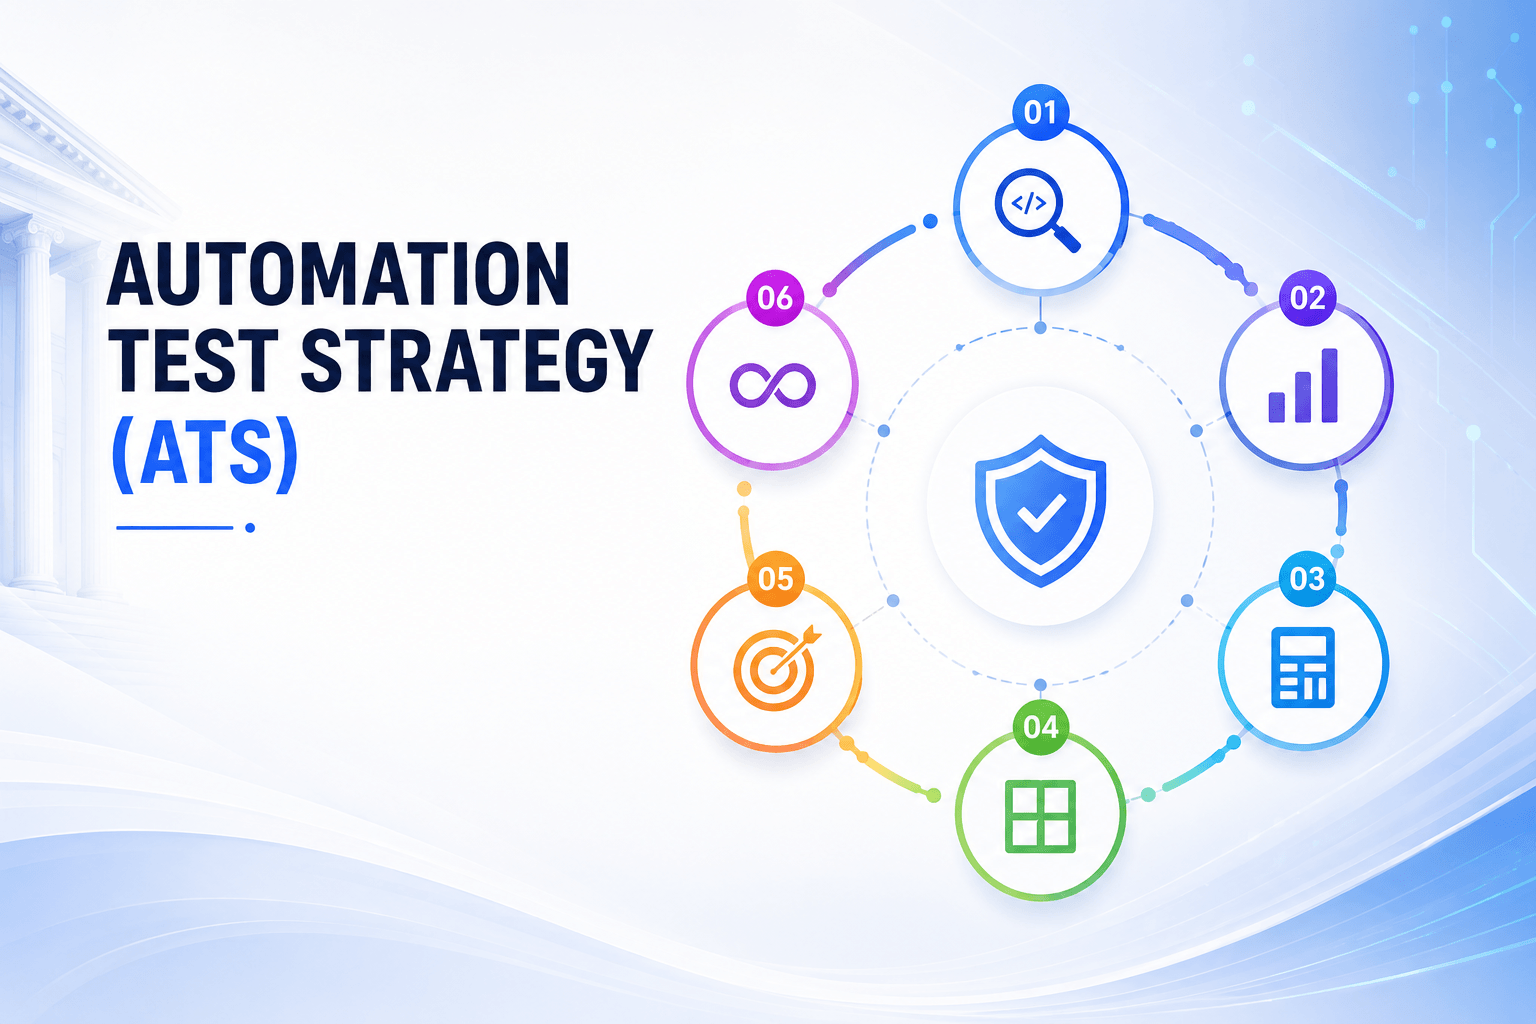
The institution introduced a product-risk-driven Automation Testing Strategy (ATS) tailored to unearth and mitigate top business failures early in the software development lifecycle. Moving away from traditional volume-heavy manual testing, this strategy aligned with Agile and DevOps practices by accelerating code validation through a “Fail Fast” mechanism. The strategy acknowledges that while 100% test automation coverage is an unrealistic goal, energy must be focused where software failures would cause the highest negative business impact.
Mathematical Risk Prioritization via FMEA
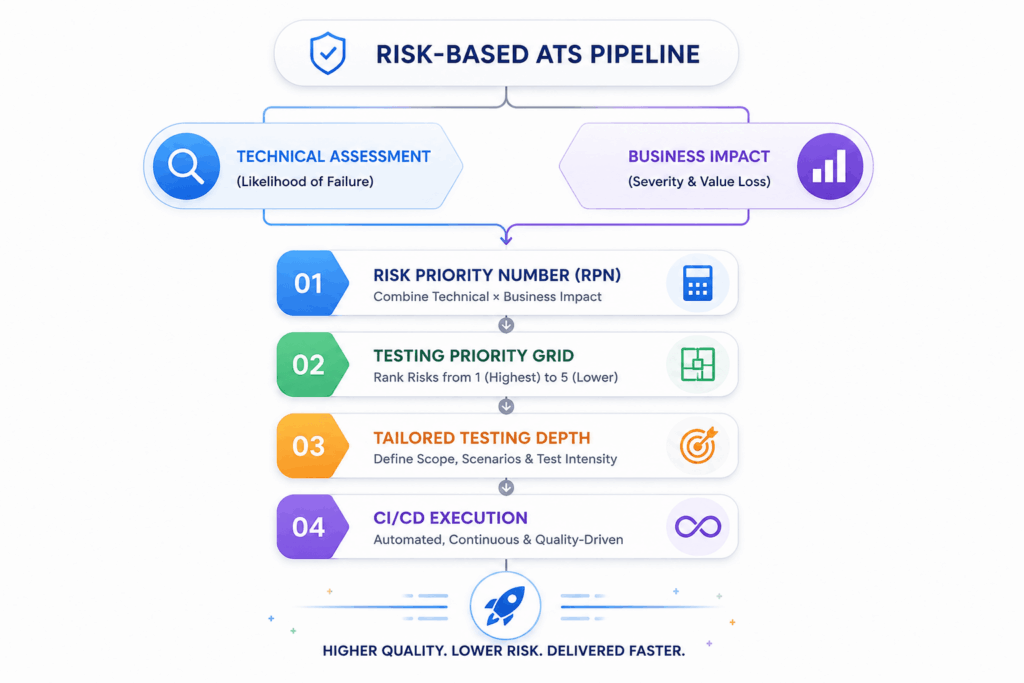
To systematically identify which test cases yielded the highest value, the institution and its partners utilized a formalized Failure Mode and Effects Analysis (FMEA) approach. Through cross-departmental brainstorming sessions involving Development, Testing, Operations, and Business teams, potential production vulnerabilities were mapped out. The FMEA framework evaluates each potential failure using three strict attributes scored on a scale of 1 to 5:
- Severity (S): Measures the operational damage, ranging from a Scale 1 (Urgent: Loss of data, hardware, or safety issues) to Scale 5 (Cosmetic or trivial).
- Priority (P): Assesses the loss of core business or system value, ranging from Scale 1 (Urgent: Complete loss of system value) to Scale 5 (Negligible reduction).
- Likelihood (L): Quantifies the technical probability of failure in live operations, running from Scale 1 (Urgent: Certain to affect all users) to Scale 5 (None: Unimagined in actual usage).
To determine testing priority, these attributes are multiplied to calculate the Risk Priority Number (RPN):
RPN = S x P x L
Within this scoring framework, a lower RPN mathematically signifies a higher business risk.
The 3×3 Testing Priority Grid
Test cases were mathematically categorized along a 3×3 grid matching the Likelihood of Failure (vertical axis evaluated by the technical team) against the Impact of Failure (horizontal axis evaluated by the business team).
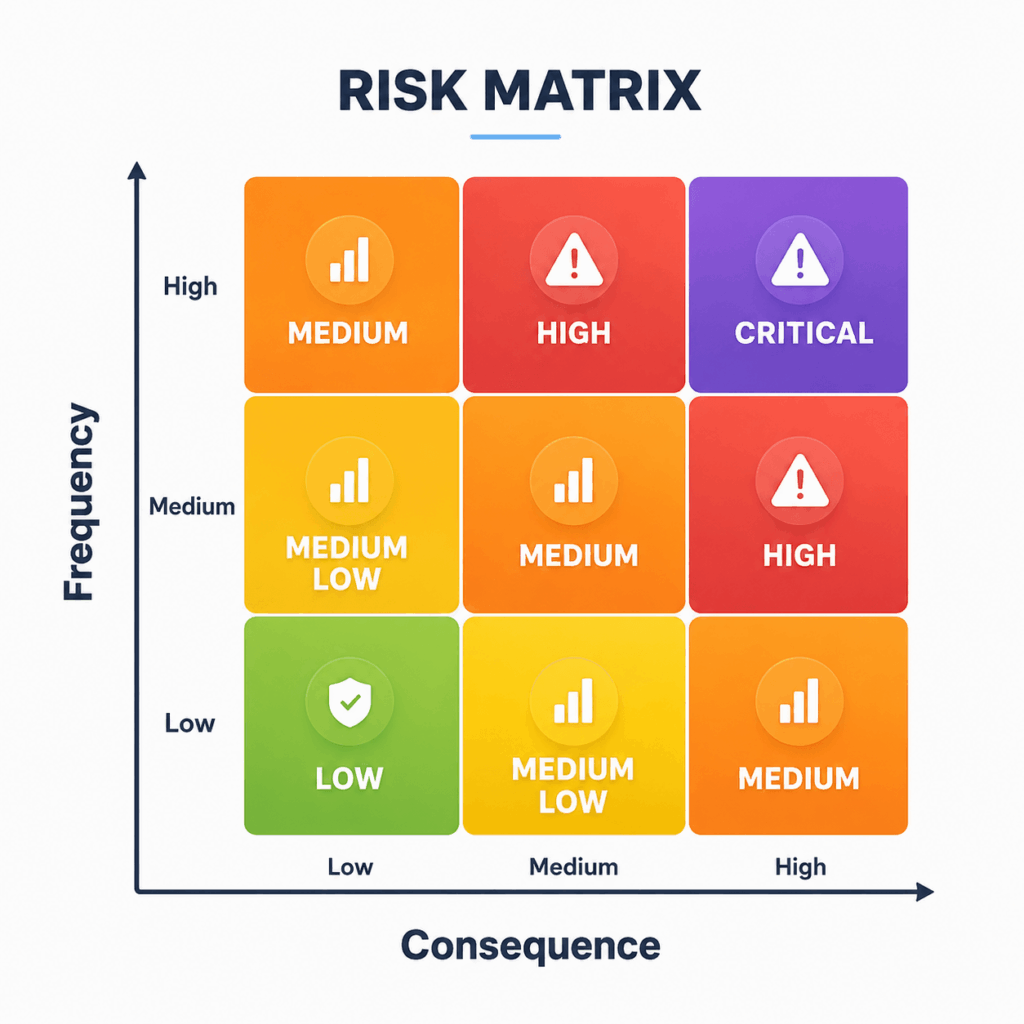
This matrix structured test execution into 5 definitive rankings:
- Priority 1 (Top Right Corner): High Likelihood & High Impact (Interruption). These critical pathways undergo More Thorough testing executed by veteran domain experts.
- Priority 2 & 3: Moderate risk scenarios requiring Thorough standard test protocols.
- Priority 4: Lower risk features receiving basic Identification verification.
- Priority 5 (Bottom Left Corner): Minimal risk or cosmetic items that are safely De-scoped if testing timelines or engineering resources are restricted.
Automation Shield Projects Selection (ASPS)
Because of the massive volume of active financial applications running within the bank, automation could not be applied universally. To manage this, the bank established the ASPS Configuration Control Board (CCB), uniting representatives from IT, Development, Operations, and Business departments.
The CCB utilizes the FMEA framework to audit and select which high-priority projects are granted admission into the protective “Automation Shield” on a yearly basis. Approved software systems enter an “initiate” status, where specific automation script development and maintenance roles are assigned to technical leads to optimize the cost-to-benefit ratio.
Additionally, vendor and subcontractor control was synchronized with this protocol. Procurement mandates that all external software suppliers apply identical risk-based automation strategies and present concrete test execution evidence before any third-party financial services or products are acquired.
Return on Investment (ROITA) Analysis
To justify the expenditure on automation frameworks, the project tracked the Return on Investment from Test Automation (ROITA). ROITA acts as a direct ratio comparing calculated time/cost savings against the cumulative cost of script creation, hardware, and upkeep. The user value derived from saved time is formulated as:
TS = TM – TA
Where TS is the time saved , TM represents manual execution time , and TA represents automation execution speed. Conversely, total automation costs (CA) encompass hardware/software licenses (CHS), script development and maintenance effort (CDM), and personnel training costs (CT):
CA = CHS + CDM + CT
Empirical Efficiency Metrics Across 500 Test CasesUsing an empirical baseline of a 500-test suite monitored over a multi-year period, the strategy mapped the definitive correlation between release frequency and financial efficiency:
- Low-Frequency Builds (18 cycles/year – 3-week intervals): Due to high upfront hardware/software (€40,000) and initialization costs, ROI remains negative in the initial years (-47% in Year 1) but breaks even, turning positive by Year 4 (+6%) and reaching +14% by Year 5.
- Sprint-Driven Frequencies (30 cycles/year – 2-week sprints): Accelerated test runs drive faster amortization, with ROI flipping positive in Year 2 (+14%) and rising to +116% by Year 5.
- Continuous Integration Builds (50 cycles/year – Weekly releases): Maximizing the automated CI/CD pipeline results in an immediate positive ROI of +44% in Year 1, exploding to an impressive +290% net savings return by Year 5.
Business Outcomes and Technical KPIs
The implementation of the ATS framework effectively optimized the bank’s delivery pipeline, ensuring software stability while heavily reducing human error. Progress and quality metrics are reported to senior management using data-driven Key Performance Indicators:
- Minimized Defect Escape and Age: By embedding QA tightly into the initial Requirements Analysis phase, the average defect age (the time between introduction and detection) was drastically shortened, enabling developers to remediate code flaws at a fraction of post-production costs.
- Optimized Defect Removal Efficiency (DRE): The integration of daily automated regression runs across the CI/CD pipeline maximized the percentage of bugs captured and removed during pre-release cycles.
- Precision Workhorse Allocation: Engineers were entirely freed from burning weekends running low-priority, cosmetic manual tests. Instead, technical effort was reallocated toward reinforcing vital system functionalities and refining the end-to-end user experience.
Conclusion
The successful deployment of the Automation Test Strategy demonstrates that software stability in enterprise banking does not require an infinite testing window. By applying strict mathematical FMEA risk modeling, establishing an active Configuration Control Board, and tracking empirical ROITA matrices, financial organizations can optimize their QA investments. The result is a highly predictable, automated, and customer-focused release cycle that safeguards both corporate revenue and consumer trust.
Is your team struggling with tight delivery timelines or escalating testing costs? Modernize your engineering pipeline with risk-prioritized automation. Contact the QA and Project Management Experts at SQA.bg to analyze your infrastructure today.